Tab: User Progress | Progress
In this tab you will find the progress of the players in a specific course. You can access this report by going to Results > Analytics to go deeper > User Progress / Progreso.
In this tab there are 5 panels that will give you a visualization of how the participants are progressing in their courses.
Dashboard: General User Progress
Remember to use the filters in case you want to review the progress of a specific course. This first graph will show you the status of the users with their % regarding the course.
For this it is important to take into account:
Pending: The user has not started the course yet.
In process: The user started the course.
Finished: The user finished the course.
In process: The user started the course.
Finished: The user finished the course.
Panel: Progress by course.
.In this panel you can compare the progress of the different assigned courses. Like all panels, information can be downloaded directly from the 3 dots in the top corner.
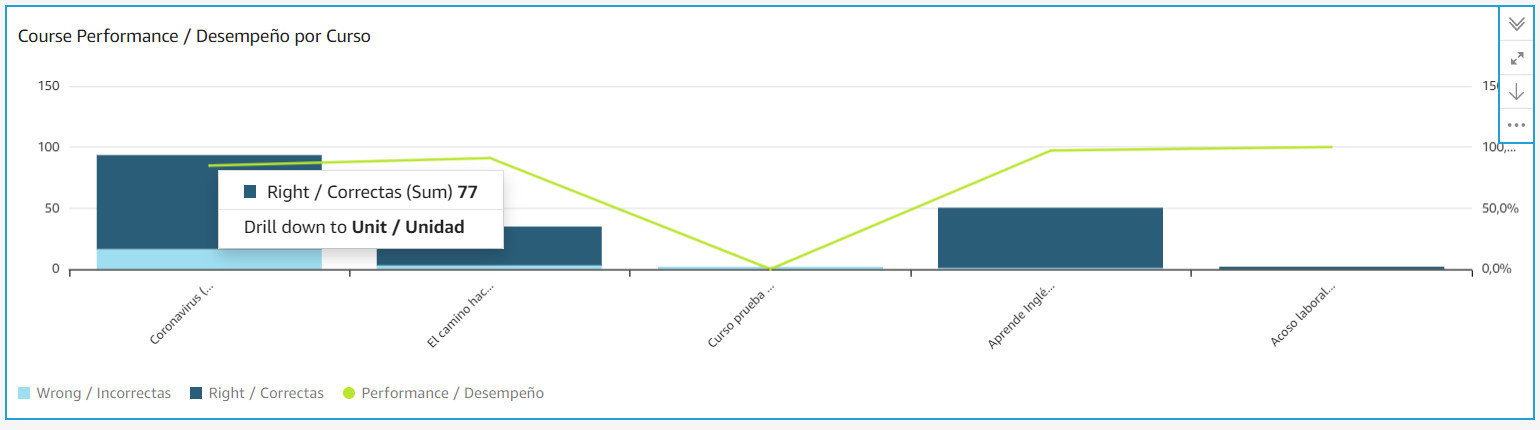
Panel: Course Performance | Performance by Course
This graph shows the relationship of correct and incorrect answers between the different courses, as well as the performance in percentage between each of them.
In blue: Sum of correct answers.
In light blue: Sum of incorrect answers.
Green line: Represents the general performance in comparison with each of the courses.
Panel: Average Course Score by Team and Accumulated User Score
These two panels show the accumulated score by Team and by User, providing a ranking according to performance.
 Remember: by selecting any bar on the graphs you will be able to see a summary of the data.
 Did we miss something?  Don't worry! In case of doubts or queries, send us an email support@nivelat.com and we will help you! 🚀
Don't worry! In case of doubts or queries, send us an email support@nivelat.com and we will help you! 🚀